2016 Average Cost of Wedding in the U.S. up 3/10ths of a percent to $26,720
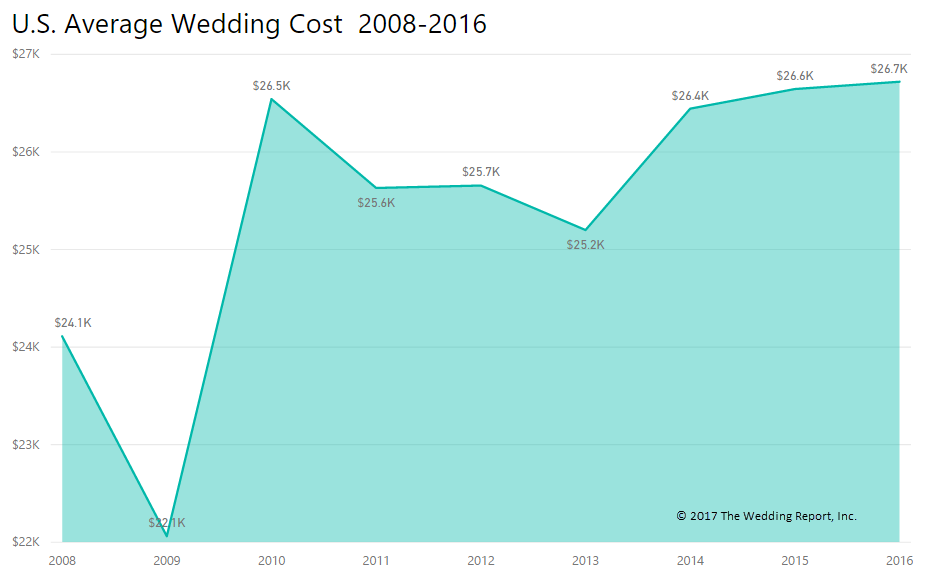
The average amount U.S. couples spent on their wedding in 2016 was up slightly to $26,720 from $26,645 in 2015. The latest average wedding cost data is based on 9,298 survey samples collected from January 1, 2016 through December 31, 2016. The average number of guests for 2016 was 125, down by 1 guest from 2015’s 126 number.
The Invitation and Flower category saw the biggest increase in spending, 3.3% to 5.2%, while Photography, Video and Planning saw the biggest decrease in spending, -2.0% to -3.9%.
All local spending data has been updated with the new 2016 survey results.
| Market Totals | 2015 | 2016 | Chg % |
| Market Summary | $26,645 | $26,720 | 0.3% |
| Attire & Accessories | 2015 | 2016 | Chg % |
| Dress Accessories | $226 | $224 | -0.7% |
| Tuxedo/suit/other Accessories | $101 | $103 | 1.7% |
| Tuxedo/suit/other Rent/purchase | $203 | $208 | 2.5% |
| Wedding Dress/es | $1,226 | $1,221 | -0.4% |
| Beauty & Spa | 2015 | 2016 | Chg % |
| Hair Service | $66 | $67 | 1.4% |
| Makeup Service | $53 | $54 | 1.4% |
| Manicure & Pedicure | $44 | $45 | 1.2% |
| Entertainment | 2015 | 2016 | Chg % |
| DJ | $728 | $735 | 1.0% |
| Live Band | $1,706 | $1,695 | -0.7% |
| Musician/s, Soloist, or Ensemble | $611 | $618 | 1.2% |
| Flowers & Decorations | 2015 | 2016 | Chg % |
| Boutonnieres, Corsages | $144 | $147 | 1.8% |
| Bridal Bouquet | $148 | $152 | 2.7% |
| Bridesmaid Bouquets | $179 | $188 | 5.0% |
| Event Decorations | $446 | $446 | 0.0% |
| Event Flower Arrangements | $438 | $432 | -1.4% |
| Event Table Centerpieces | $325 | $326 | 0.3% |
| Flower Girl Flowers | $85 | $89 | 4.2% |
| Flower Petals | $95 | $98 | 2.7% |
| Gifts & Favors | 2015 | 2016 | Chg % |
| Gift/s for Attendants | $104 | $104 | -0.1% |
| Gift/s for Parents | $120 | $122 | 1.6% |
| Tips (for all services) | $385 | $384 | -0.2% |
| Wedding Favors | $235 | $239 | 1.7% |
| Invitations | 2015 | 2016 | Chg % |
| Ceremony Programs | $121 | $127 | 5.2% |
| Engagement Announcements | $105 | $108 | 3.3% |
| Guest Book | $59 | $61 | 2.6% |
| Invitations & Reply Cards | $228 | $226 | -0.7% |
| Postage | $106 | $105 | -0.9% |
| Reception Menus | $124 | $125 | 1.0% |
| Save the Date Cards | $112 | $112 | 0.4% |
| Table Name and Escort/place Cards | $83 | $85 | 2.0% |
| Thank You Cards | $89 | $90 | 1.3% |
| Jewelry | 2015 | 2016 | Chg % |
| Engagement Ring | $3,386 | $3,407 | 0.6% |
| Wedding Bands | $1,254 | $1,242 | -0.9% |
| Photography & Video | 2015 | 2016 | Chg % |
| Digital or Photo cd/dvd | $305 | $294 | -3.5% |
| Engagement Session | $396 | $398 | 0.4% |
| Prints and/or Enlargements | $237 | $238 | 0.5% |
| Wedding album/s or photo book/s | $428 | $421 | -1.6% |
| Wedding Photographer | $1,644 | $1,611 | -2.0% |
| Wedding Videographer | $1,068 | $1,072 | 0.4% |
| Planner/Consultant | 2015 | 2016 | Chg % |
| A La Carte Services | $957 | $943 | -1.5% |
| Day of Coordinator | $825 | $812 | -1.6% |
| For Getting Started | $883 | $875 | -0.9% |
| Full Service | $2,886 | $2,773 | -3.9% |
| Month of Direction | $1,085 | $1,062 | -2.1% |
| Venue, Catering & Rentals | 2015 | 2016 | Chg % |
| Ceremony Officiator | $208 | $214 | 2.7% |
| Event Accessories | $325 | $327 | 0.7% |
| Event Bar Service | $2,378 | $2,378 | 0.0% |
| Event Food Service | $4,771 | $4,674 | -2.0% |
| Event Location | $3,628 | $3,610 | -0.5% |
| Event Rentals | $1,719 | $1,737 | 1.0% |
| Hotel Room for After Reception | $309 | $315 | 2.0% |
| Limo Rental | $480 | $483 | 0.5% |
| Other Transportation | $515 | $518 | 0.6% |
| Rehearsal Dinner | $577 | $572 | -0.9% |
| Wedding Cake/dessert | $422 | $419 | -0.7% |
Demographics of Survey
| Which marriage is this for you? | |
| Percent | |
| First marriage | 90.3% |
| Second marriage | 7.8% |
| Third or more | 1.8% |
| Is this a same-sex marriage? | |
| Percent | |
| Yes | 5.0% |
| No | 94.1% |
| N/A or Decline to Respond | 0.9% |
| You are | |
| Percent | |
| Female | 79.4% |
| Male | 19.3% |
| N/A or Decline to Respond | 1.3% |
| What is your age? | |
| Average | 27.8 |
| What is your total household income? | |
| Average | $71,395 |
| Are you of Hispanic, Latino, or Spanish origin? | |
| Percent | |
| Yes | 14.2% |
| No | 81.6% |
| N/A or Decline to Respond | 4.2% |
| What is your race? | |
| Percent | |
| Asian | 4.5% |
| Black/African-American | 12.2% |
| White/Caucasian | 69.5% |
| Other | 6.8% |
| N/A or Decline to Respond | 6.9% |
| What is the highest level of education you have completed? | |
| Percent | |
| Not a High School Graduate or No GED | 1.5% |
| High School Graduate or GED | 12.4% |
| Vocational or Professional School | 3.2% |
| Some College | 21.9% |
| Associate Degree | 10.8% |
| Bachelors Degree | 33.8% |
| Masters Degree or Doctorate | 13.5% |
| N/A or Decline to Respond | 3.0% |
| What is your occupation? | |
| Percent | |
| Architecture and Engineering | 2.3% |
| Arts, Design, Entertainment, Sports, and Media | 4.1% |
| Building and Grounds Cleaning and Maintenance | 0.2% |
| Business and Financial Operations | 8.1% |
| Community and Social Services | 2.5% |
| Computer and Mathematical | 3.9% |
| Construction and Extraction | 1.0% |
| Education, Training, and Library | 9.1% |
| Farming, Fishing, and Forestry | 0.5% |
| Food Preparation and Serving Related | 3.6% |
| Healthcare Practitioners and Technical | 8.9% |
| Healthcare Support | 5.2% |
| Installation, Maintenance, and Repair | 0.6% |
| Legal | 2.7% |
| Life, Physical, and Social Science | 1.5% |
| Management | 8.1% |
| Military Specific | 1.6% |
| Office and Administrative Support | 4.7% |
| Other | 13.0% |
| Personal Care and Service | 1.5% |
| Production | 1.0% |
| Protective Service | 0.7% |
| Sales and Related | 6.5% |
| Transportation and Material Moving | 0.7% |
| N/A or Decline to Respond | 8.2% |
Get More Wedding Data!
Unlock valuable insights and knowledge about the wedding industry with our in-depth analysis.