2025 United States Wedding Market Statistics & Analysis
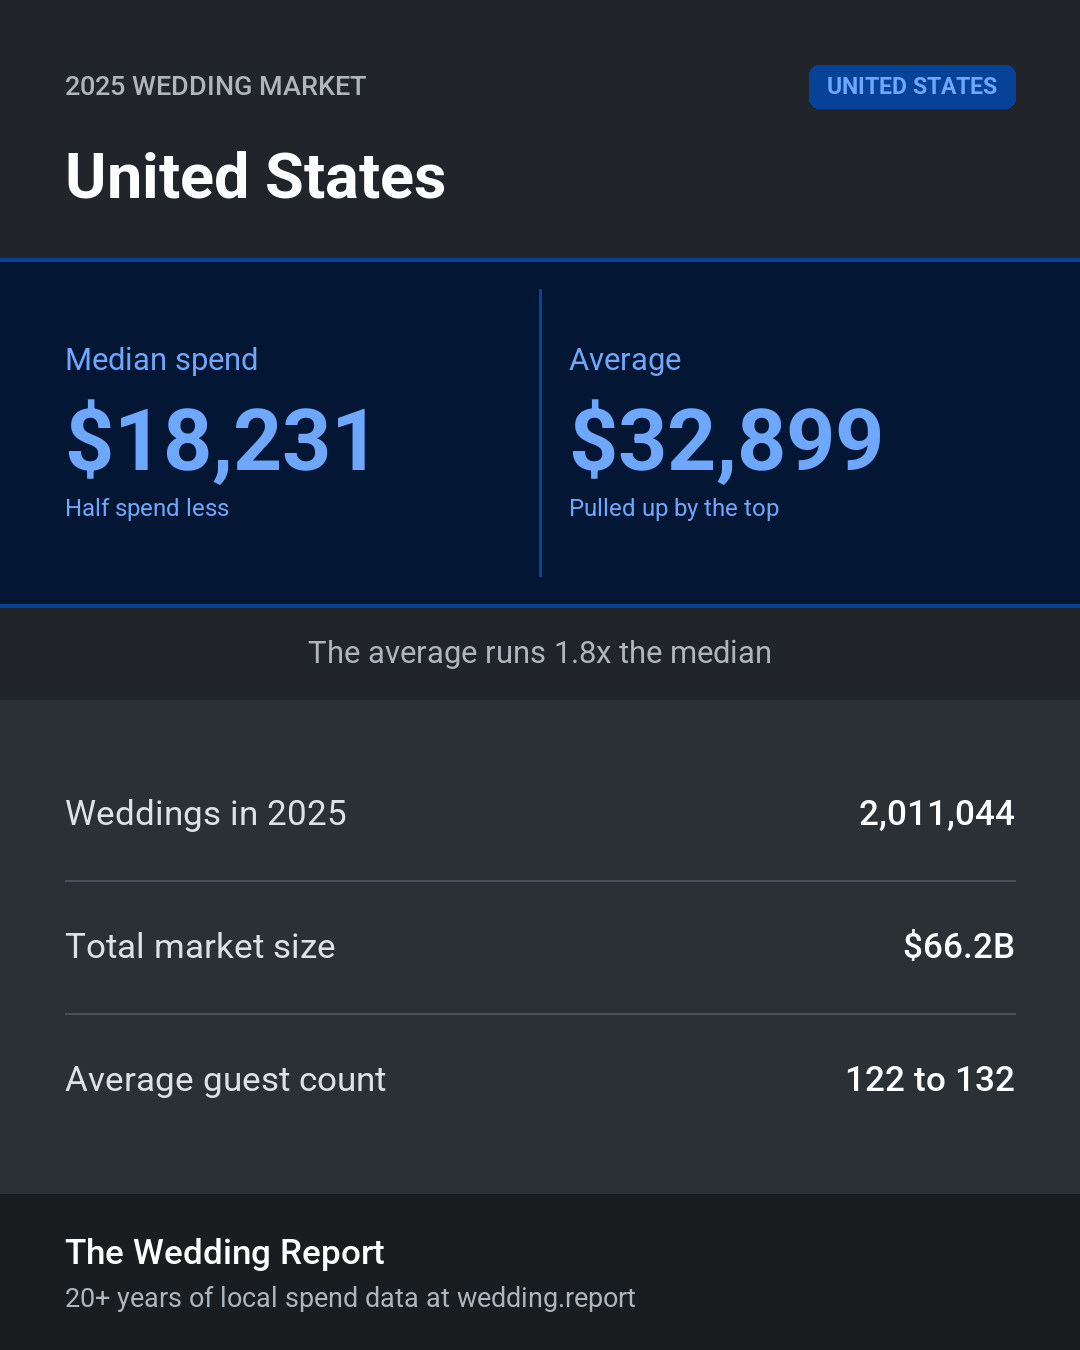
United States couples spent about $66.16 billion on weddings in 2025, across 2,011,044 weddings. These are the real local numbers, built from 20+ years of actual spending data, not the inflated national averages most of the industry quotes.
2,011,044
2025 Number of Weddings$32,899
2025 Average Wedding Cost$18,231
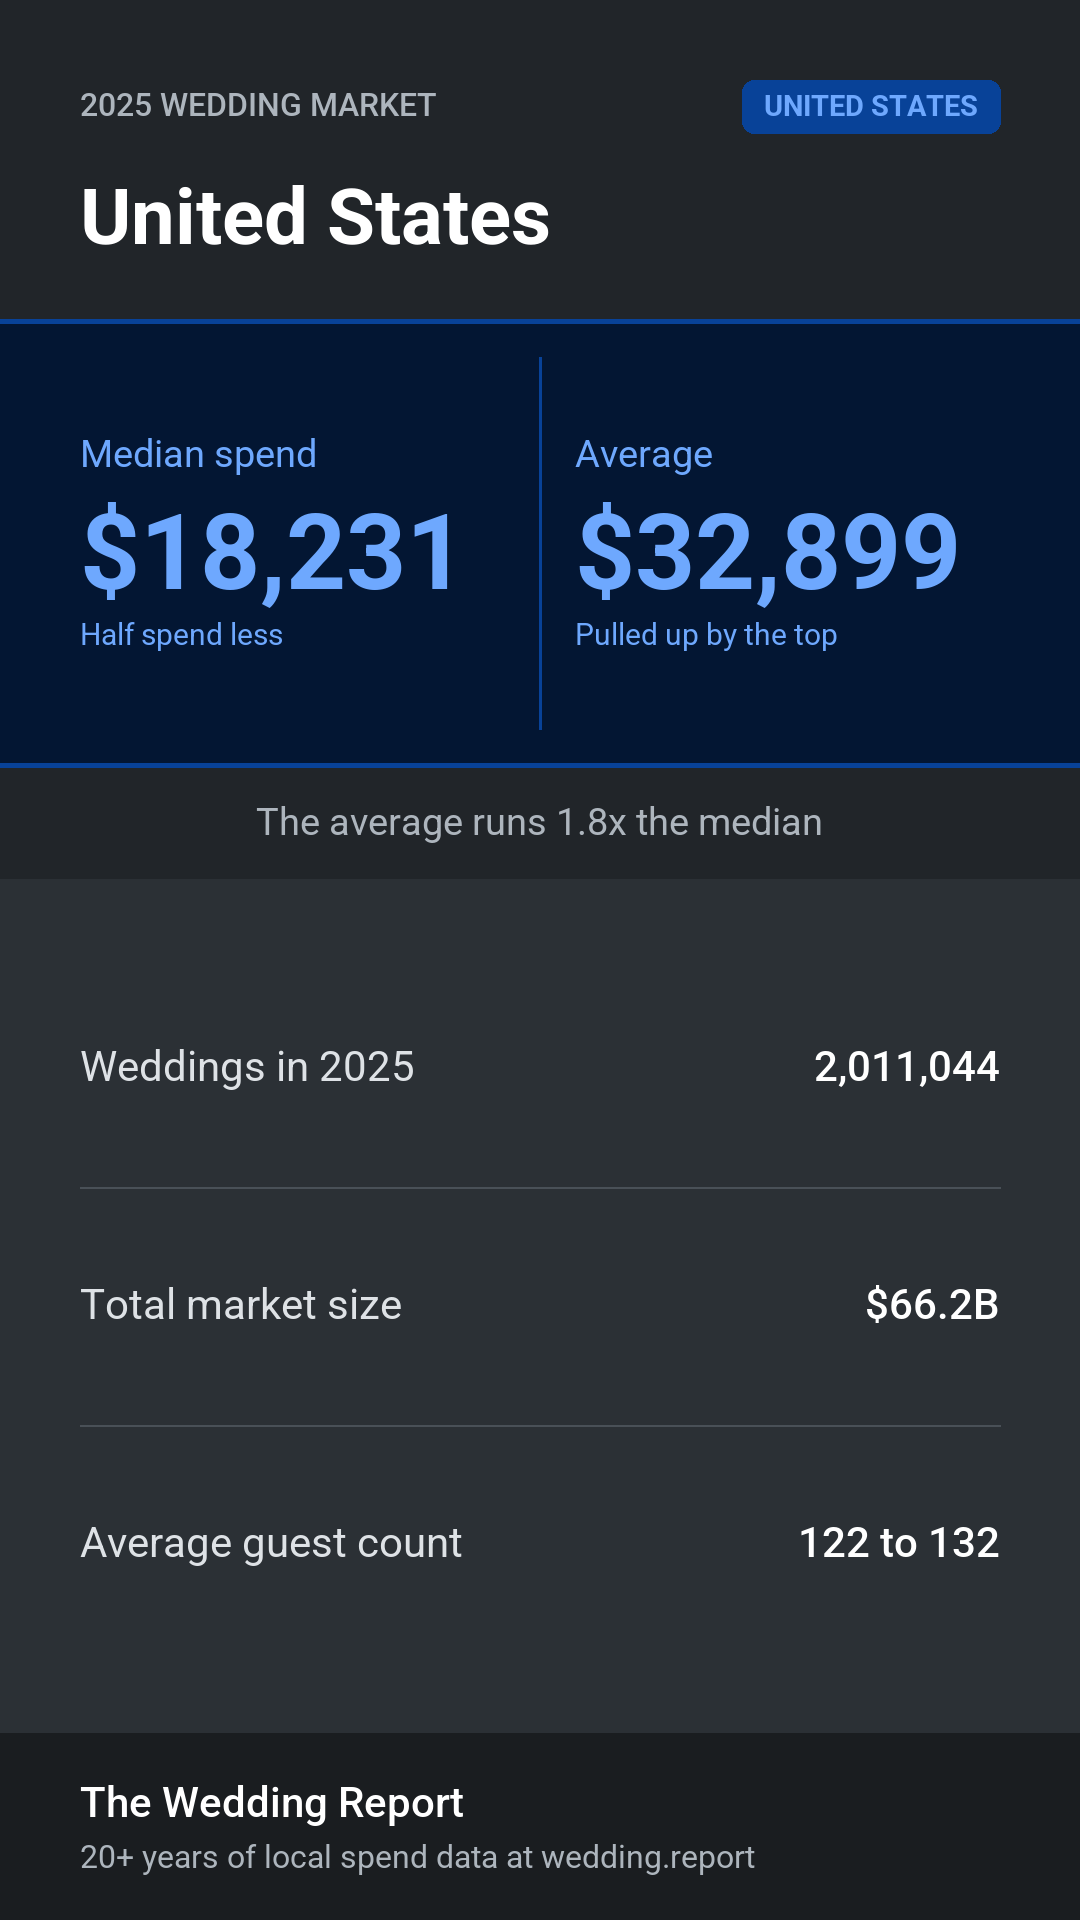
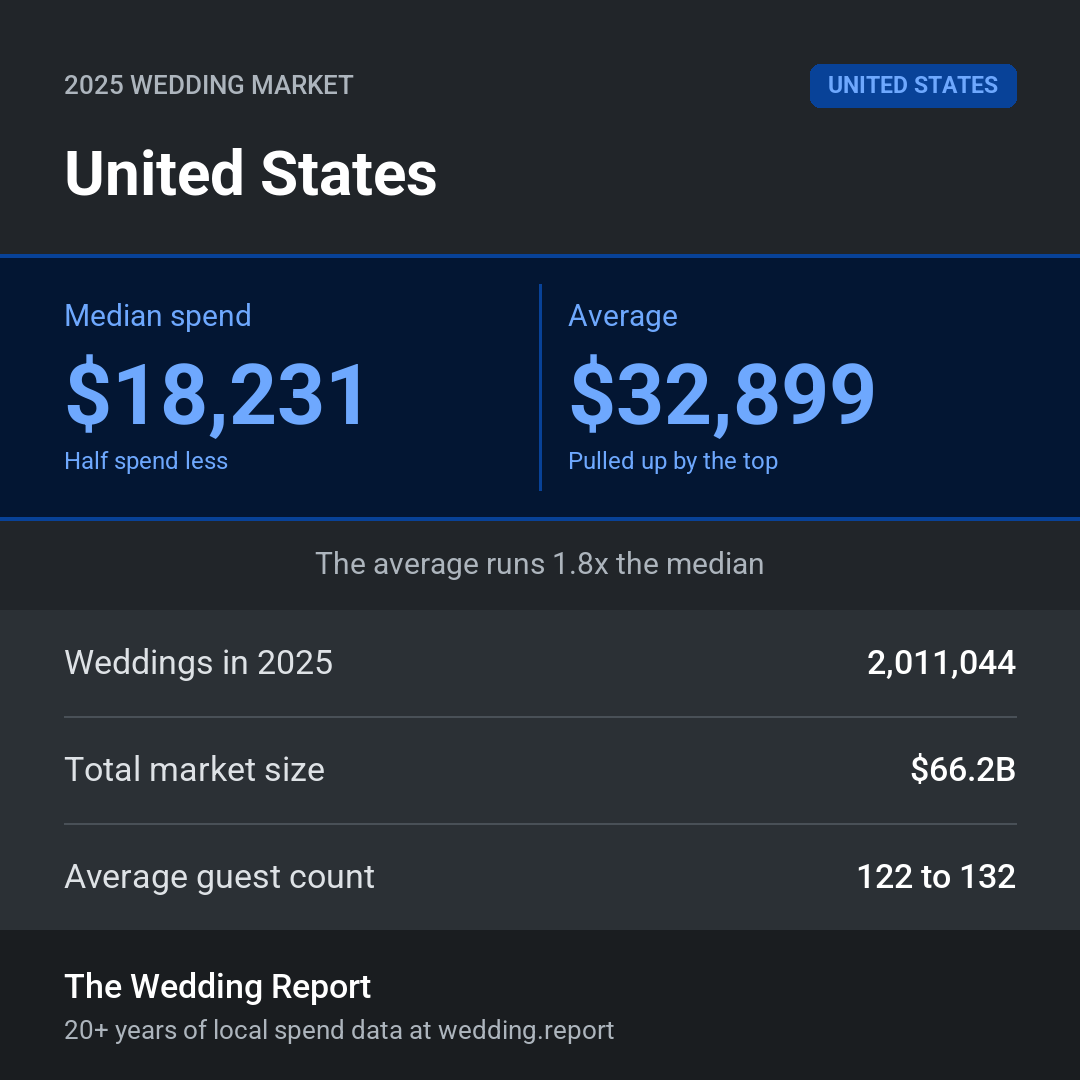
2025 Median Wedding SpendAcross 2,011,044 weddings in 2025, couples spent an average of $32,899. The median was $18,231, so half of United States couples spent less than that. If you sell to United States couples (venue, planner, photographer, caterer, florist), those two numbers are the floor and ceiling for your local pricing.
Need Market Intelligence for One Category?
Purchase a complete category report for this market. See category details
$95 one-time purchase
Business Insights for the United States Wedding Market
What is the average cost of a wedding in United States?
What is a realistic wedding budget for most couples in United States?
How many weddings happen in United States each year?
How big is the United States wedding market?
What should I charge for my wedding services in United States?
How many guests does the average United States wedding have?
Is United States a good place to start a wedding business?
Why is this data different from other wedding cost reports?
Detailed Market Breakdown
Demand
In 2025, United States hosted 2,011,044 weddings. Demand at that level holds steady year over year, which gives vendors a reliable base to plan against.
Spending
Total spend on weddings in United States reached $66,161,336,556 in 2025. The average wedding ran $32,899, the median $18,231. The gap between those two is the whole story: a smaller number of high-spend weddings pulls the average up, while most couples land nearer the median.
What it means for your pricing
Here's what the numbers say about the United States market. The spread shows high-end weddings lifting the average, while the typical wedding runs more budget-conscious. This market generally favors mid-sized weddings. That points to a large market for services and packages aimed at affordable weddings, not just the top end.
A Note on This Data
This data reflects what couples in United States actually report spending, across every budget, size, and style. It includes new and used items, professional services, and help from friends or family. It runs lower than some industry reports, and that's the point. It's a more realistic view of what couples in your area spend, which is what you want when you're making real pricing decisions.